
20 Years of Declining Immigration and the Disappearance of Low Skilled Immigrants
By Giovanni Peri
The Fact:
If one considers the very basic statistics related to immigration to the United States over the last 20 years, two particularly notable things stand out in the data. The first is the significant recent decline in total net immigration relative to the 1990s, and the slowing of its role as a driver of growth in the US working age population (ages 18-65). The second is that the net immigration rate among less-educated, low-skilled individuals has declined substantially from the year 2000. In the last decade, net immigration of low-skilled workers has actually been negative, implying more people in that category are leaving the US than are entering it.
The Data:
The two figures below show the quantitative extent of these facts. Figure 1 shows the yearly growth in the working age population, in percentage points, due to net immigration (foreign born) and due to natural change in the US-born population, over the last three decades. Given that the most recent data available from the U.S. Census Bureau are from 2018, the third observation is a shorter period, than the others; however, the rates are annualized and thus comparable across decades.
Two facts emerge very clearly. First, compared to the period of peak immigration in the 1990’s, when immigration was responsible for a 0.65 percent increase in the working-age population each year, its contribution has declined by more than 60% to constitute only a 0.22 percent yearly growth over the 2010-2018 period. Second, this decline in immigration essentially mirrors the decline in population growth of US natives, due to large cohorts of baby boomers exiting the working-age population and being replaced by much smaller cohorts of younger workers.
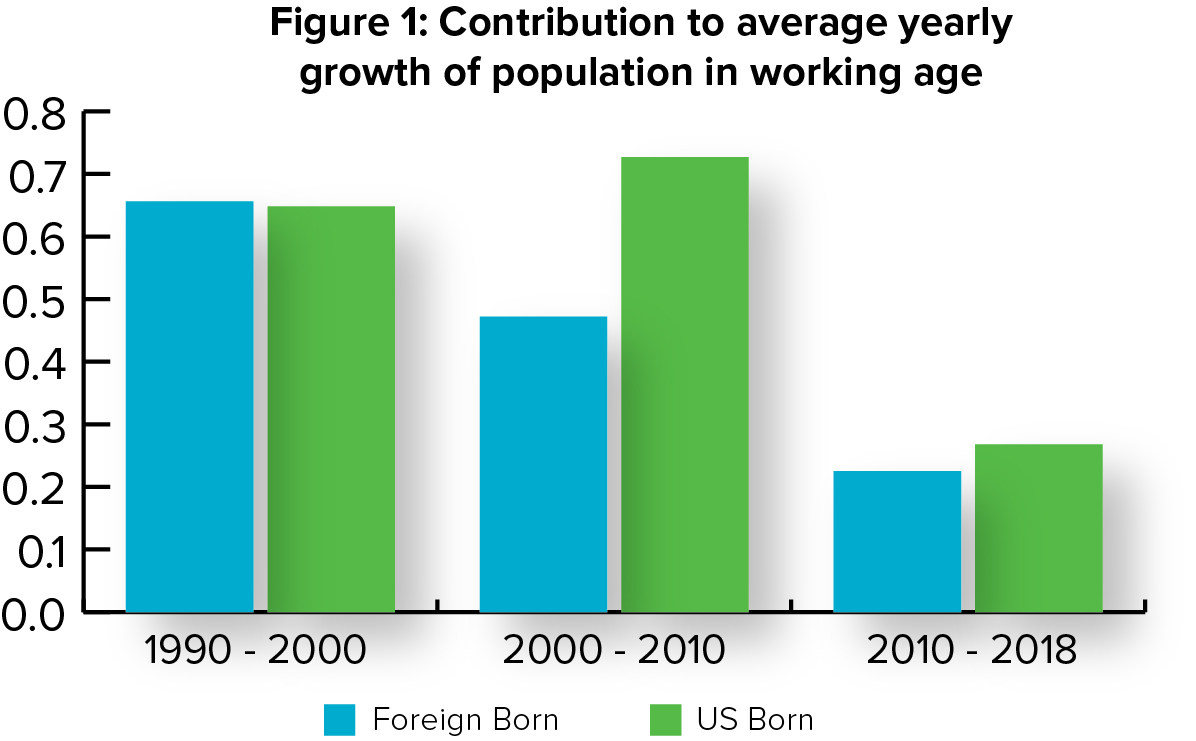
Data for the Chart are available here.
Note that the decline in the US-born working age population due to this demographic dynamic is projected to become significantly worse in the coming decade, as more and more baby boomers leave the working-age population and are not replaced by US-born citizens. In the figure we see that, in the last decade, the decline was not compensated by an increase in immigrants; rather, immigration's contribution to population growth also declined. Immigrants did not, as they have in the past, offset the shrinking size of the labor force in the last decade.
Figure 2 shows the change in composition of immigrants’ contribution to growth in the working age population along the education dimension. The bar height represents the yearly percentage growth in population for each group generated by net immigration, and the groups are arrayed by education level--from the lowest on the left, representing the group with no high school degree, to the highest on the right, representing those with a PhD or professional degree. Each decade is represented with a different color bar.
We notice a dramatic difference in the evolution of immigrant contribution to population growth between less-educated and more highly-educated groups. The group of workers with no high school degree, which in the 1990-2000 period grew by more than one percent per year due to low-skilled immigration, in the 2010-2018 period shrank by 0.5 percent per year because of the net outflow of that group from the US. On the other hand, groups at the top of the education range--those with a Master’s degree or higher--continued to grow at a rate of 0.5 percent per year or more thanks to net immigration. In fact, in the most recent decade the groups with a Master’s degree or a Ph.D. have been growing the fastest due to net immigration, while groups without a college education either did not grow much or shrank as a consequence of foreign-born flows.
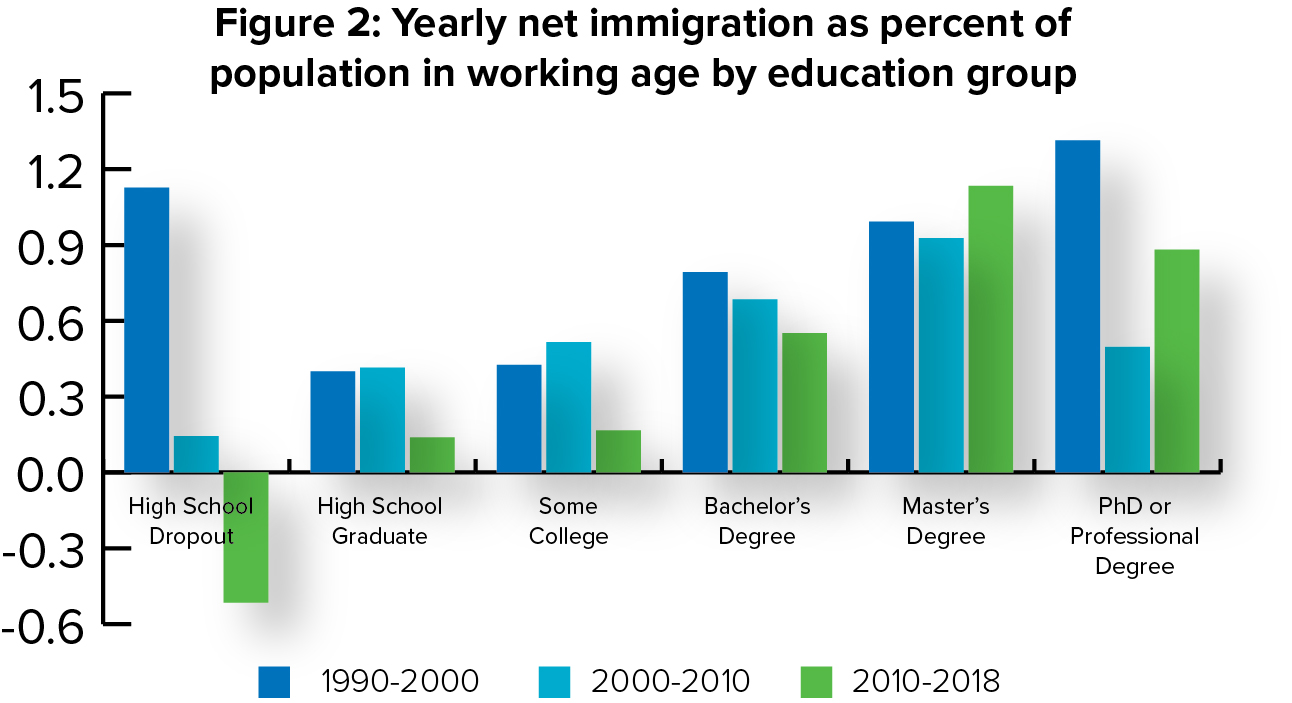
Data for the Chart are available here.
This change in immigrants’ skill composition corresponds a change in their countries of origin. While Mexican and Central American immigration dominated the inflows during the 1990-2000 period with a net growth of almost 5 million people during that decade (source Census data), immigrants from Asia constituted the fastest growing group over the last 20 years with a net growth of about 4 million working age people. Asians immigrants to the US are now nearly as numerous as Mexicans and Central Americans: the 2018 American Community Survey revealed that 10.1 million residents between 18 and 65 were from Asia, while 12.8 million were from Mexico and Central America.
What Does this Mean for the Economy?
These two very simple facts have two important implications. First, considering individuals with different education as different types of workers with different types of skills, the numbers suggest less competition and more opportunities for low-educated natives in the last 20 years, and higher competition for jobs requiring higher education. This immigration pattern is beneficial for less-skilled workers, and potentially damages the opportunities of high-skilled workers. Again, contrary to the common rhetoric of immigrants taking jobs from working class America, it looks like professionals and scientists should be more concerned than should low-skilled workers.
Second, with the labor market as it is currently, the continued decline of immigrants is contributing to a tighter market and slowing the growth opportunities for firms who struggle to find workers. According to the Bureau of Labor Statistics, new job openings have outnumbered unemployed workers looking for a job for more than two years, now. In aggregate, the result of this increasing demand for labor being unmet by the supply of available workers may push up wages, with benefits for US citizens, but it may also increase the offshoring of jobs, inspire more automation that replaces jobs, or simply slow the economic growth of firms. These responses will hurt American workers.
What Should this Mean for Policy?
Knowing facts is key to the adoption of good policy. The most discussed immigration policies of today--building the wall, stopping the flow through the southern border, protecting low skilled US workers--are policies that have economic motivations that, if they were ever true, were only so at least 20 years ago.
Given the facts presented above, three greater policy considerations would be:
- How do we control the inflow of immigrants in a way that compensates for the shrinking labor force caused by aging and demographic decline?
- How do we manage the inflow of highly skilled immigrants from Asia to allow them to produce growth and economic benefits for the US economy while fully realizing their potential?
- How do we let demand in the labor market inform and direct the number and skill level of immigrants needed by the US economy?
Considering the presented facts, the economic health and longevity of our country has no need for a wall, but rather a great need for thoughtful immigration policies that allow immigrants to work legally and productively in ways that meet the needs of the US economy.
View and download this Immigration Fact
Download supporting data for Figures 1 and 2