
Immigration in local US economies was associated with strong native wage growth in the past 40 years
By Giovanni Peri and Vasil Yasenov
The Facts:
In each decade from 1980 to 2018, there has been a positive correlation between the growth of immigrants, as share of the population, and the growth of weekly wages paid to native workers across US local labor markets (referred to as “commuting zones” in population and economic analyses).
This correlation has been strong and significant both in the pre-recession years of 2000-2008, as well as throughout the recession and recovery of 2008-2018. A one percent increase in foreign population share was associated with a 0.7 to one percent increase in native wages.
The Data:
One way to analyze the local labor markets’ long-run success is to look at their average wage growth. Identifying factors that are associated with strong wage growth and labor demand is particularly important as (i) wages are the largest component of households’ income and (ii) during the last 40 years the median US worker has experienced virtually no earnings growth.
The four panels of Figure 1 show the association between changes in the working age population’s share of immigrants (horizontal axis), and the changes in average weekly wages for native workers (vertical axis) across 722 US labor markets. Each graph illustrates a different period, starting with decades 1980-1990 and 1990-2000 in the top panels, then showing the more recent periods of 2000-2008 and 2008-2018 in the bottom panels. Each bubble represents a single commuting zone, defined as a geographic area that is self-contained in terms of people working and living in it. Its size is proportional to the population of the labor market. These units cover the whole US territory and include large cities such as New York, Chicago or San Francisco (the largest bubbles) as well as minor rural markets.
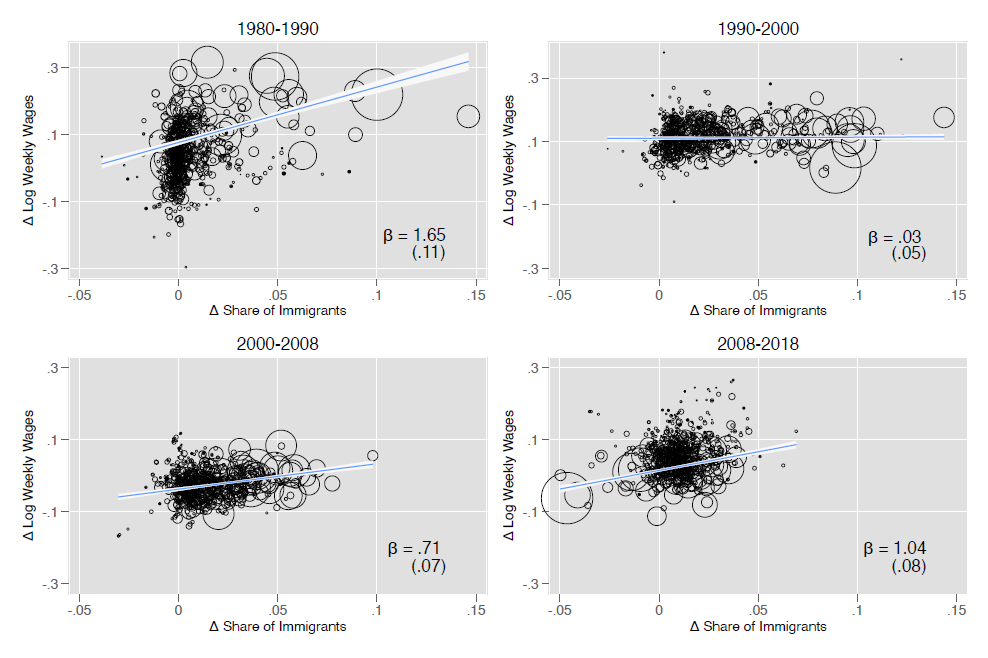
Each panel also shows the regression line, the estimated coefficient (β) representing the slope of this line and the associated standard error. Notice that the slope is positive in all panels, implying that in each period, labor markets which experienced an increase in the share of immigrants also saw higher wage growth for native workers. In particular, in the more recent periods before the Great Recession (2000-2008) and throughout the recession and recovery (2008-2018), the correlation has been large and statistically very significant.
Before the recession in 2000-2008, most commuting zones were experiencing a net growth in immigrants, as most changes in immigrant shares are positive in that panel. The figure also indicates that those with larger inflows had higher native wage growth. During and after the recession in 2008-2018, many commuting zones experienced a decline in immigrants as many changes in immigrant shares are negative in that panel. Those with a larger loss of immigrants also experienced a larger decline of native wages.
In these periods, an increase in immigrant share of the population by one percentage point was associated with an increase in growth of native wages by 0.7 to one percent. So, for instance, a commuting zone that reduced its foreign born population share by four percent, such as Maricopa County, AZ, was also likely to experience a slower native wage growth by nine percent relative to a locality that gained five percent of foreign-born, such as Baker County, OR.
What does it mean for the economy?
There are at least two reasons for this positive correlation. First, immigrants responded to good labor market conditions and moved to local economies where wages were growing, both for them and for native workers. Second, their inflow did not hurt native wages nor displaced native workers, in net. This may have been because they specialized in different jobs, contributed to local demand, attracted investment and improved skill diversity and growth.
This simple correlation does not tell us the relative importance of each of these factors, and existing research suggests that they all likely contributed to the overall effect. What is remarkable, however, is that in spite of the frequently heard claims that immigrants depress wages, the net association between immigration and native wages has been positive and mostly significant for each decade of the last 40 years. An observer of the US economy would notice that higher immigration went systematically together with higher economic success for native workers.
What should this mean for policy?
First, recognizing the positive correlation between immigration and local labor market success should be an important driver of policies. As immigrants are likely to respond to labor market incentives, it may be better to admit more immigrants in periods of strong labor demand growth. The US could make the number of immigrants it allows dependent on the health of its labor market and acknowledge that large cities should have a role in determining these numbers.
Second, as locations attracting more immigrants are more likely to experience native wage growth, pointing out this relationship may help people recognize the important connection between immigration and the economic success. This would increase positive attitudes towards immigrants.