Portrait Image

Zachariah Rutledge
Position Title
- Assistant Professor

Immigrants tend to begin their experience in the host countries at a disadvantage when it comes their earnings compared to similar native-born workers (natives). Over time, however, they tend to make progress on closing this earnings gap; although, for a variety of reasons, they may experience difficulty in eliminating it entirely. Over the past few decades, immigrants from Mexico and Central America have made significant progress in the rate at which their earnings converge towards the long-run equilibrium when compared to similar U.S. natives, which means that more recent groups of immigrants (cohorts) are earning relatively more over their lifetime than their predecessors. This increased rate of convergence is also true for their employment rate. In fact, Latin American immigrants have consistently been able to achieve employment rates that are higher than their native counterparts, revealing that they arrive in the U.S. with a high propensity to work and do not expect to live off of social services.
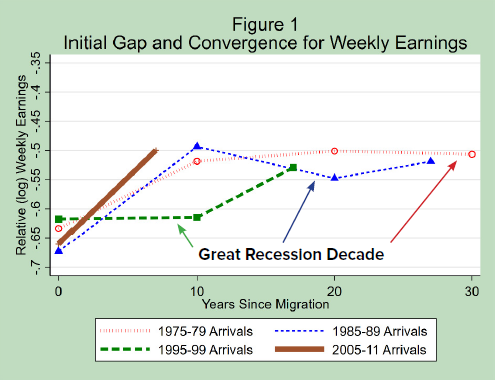 Figure 1 depicts the evolution of the earnings gap for Mexican and Central American immigrants when compared to similar U.S. natives using U.S. Census and American Community Survey data between 1980 and 2017.[1] The vertical axis depicts the ratio of immigrant earnings to native earnings on a logarithmic scale. A value of less than 0 indicates that immigrant workers are earning less than natives, and values that are located towards the bottom of the figure indicate that immigrants are doing worse compared to natives. Each immigrant cohort is represented by a different color in the figure. The oldest cohort considered is the group that arrived in the U.S. between 1975-79 (in red), while the youngest cohort is the one that arrived between 2005-11 (in brown). Data points on the left of the figure (i.e. at 0 “Years Since Migration” on the horizontal axis) represent the earnings gap for each immigrant cohort upon arrival to the U.S., and following a particular cohort’s line towards the right of the figure reveals the evolution of the earnings gap for that group of immigrants. Line segments that slope towards the upper-right of the figure indicate that a cohort’s earnings have converged towards those of natives, and steeper line segments indicate that this convergence is taking place more rapidly.
With the exception of the 1995-99 cohort (in green), which entered the U.S. in the period right before the great recession, each subsequent cohort converged to the -.5 mark on the figure (or 60% of native earnings) more quickly than the previous cohort, revealing that more recent immigrants have performed better in the labor market than those who arrived earlier. The colored arrows on the figure point to the period of time during which the great recession occurred for each cohort, highlighting the fact that the lack of wage growth for the 1995-99 cohort in the first decade after arrival was not due to a change in the “quality” of this group of immigrants but is, instead, a result of earnings stagnation for everyone. In fact, during the 7 years that followed the great recession, the 1995-99 cohort had essentially reached parity with all other cohorts.
Figure 2, which can be interpreted the same way as Figure 1, portrays the evolution of the employment rate gap for Mexican and Central American immigrants. The vertical axis depicts the difference between the immigrant employment rate and the native employment rate. A negative value indicates that immigrants have a lower employment rate compared to natives, while a positive value indicates that they have a higher employment rate.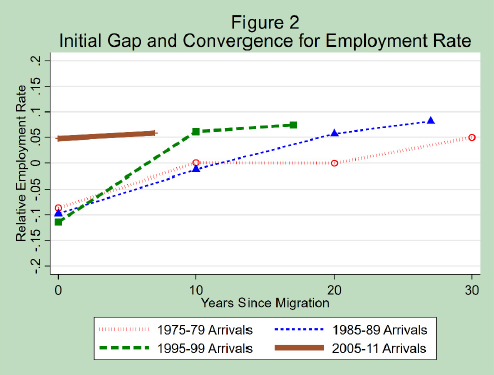
The evidence clearly shows that recent Latin American cohorts have performed better than previous ones. Each subsequent cohort has either been able to reach parity with natives (the 0 mark on the figure) at a more rapid rate or has achieved an employment rate that was higher than the previous cohort. All cohorts eventually achieved employment rates that were 5 to 10 percentage points higher than natives. The most recent cohort (2005-11 Arrivals) entered the labor market with an employment rate that was 5 percentage points higher than natives, revealing a significant improvement.
Mexican and Central American immigrants have demonstrated substantial progress in their economic assimilation over the past few decades. In recent years, they have increased the rate at which they approach their apparent long-run relative earnings equilibrium and have demonstrated a strong proclivity toward becoming employed, which reveals that they do not arrive in the U.S. expecting to live off of social welfare programs. However, they continue to experience a substantial earnings gap when compared to similar natives, which indicates that more can be done to reduce the gap even further. Because a substantial proportion of Latin American immigrants is present in the U.S. without authorization, policymakers should consider passing legislation that would provide a pathway to legal residency or citizenship. This could pull millions of undocumented workers out of the underground economy, increase the tax base by billions of dollars, and provide opportunities for Latin American immigrants to make additional progress towards reducing their earnings gap. Although not shown here, additional analysis reveals that Latin American immigrants have performed particularly well in the construction sector.[2] With such a high demand for immigrant workers in construction, policymakers should also consider a special visa program for Latin American immigrants in that sector of the economy (similar to the H-2A visa program for agricultural workers). This could help meet the demand for labor in that sector while helping Latin American immigrants close their earnings gap.
[1] This analysis compares similarly-aged immigrants and natives.
[2] For additional details, see http://ftp.iza.org/dp12976.pdf.